Meet Excel 2016: 9 of its best new features, from databases to handwriting tools
The new database features alone justify upgrading, but that's just the beginning.
1. Major database enhancements
The database enhancements alone—which include merging some of the previous Add-On programs such as Power Pivot and Power Query—more than justify the upgrade. You'll find options for Power Queries; Data Models; Reports; Pivot Tables; One-Click Forecasting; and some new, one-button workbook sharing through Power BI for creating and using interactive reports and dashboards.
2. Quick analysis tools
Quick analysis tools are a real timesaver, nudging you in the right direction with your data. After you've completed your spreadsheet or table, select the entire range. Note the lightning worksheet icon at the bottom right corner of the range: Click this icon, and a popup menu appears that displays a half-dozen options for what to do with this data.

3. New charts
Excel has six new charts to show off to your clients and colleagues. It’s still an easy process to create them, too: Just highlight the database table, select Insert > Recommended Charts, then choose one from the pictured samples.
We'll delve deeper into the new charts in an upcoming column, but here are two to whet your appetite:
Pareto sorts the bars by highest first and shows which bars have the biggest impact or highest return. Use this chart data to decide where to assign your resources.


4. New templates
Excel’s new templates come with sample data and charts, plus hands-on exercises that teach you how to use each template.

5. 3D / Power Maps
These mapping tools were an add-in program in previous versions, but they're now included in 2016. You can compare data such as temperatures, or rainfall, or populations of a given area over a specified time, rendered in three-dimensional images.
6. Easier collaboration and sharing
Real-time collaboration is finally here. Share ideas, data, queries, reports; and co-author worksheets, charts, graphs, Pivot Tables, databases, and more.Click the Share button in the top right corner. When the Share panel opens, click the Save to Cloud button. The Backstage menu opens and displays the Save As screen. Choose the option that fits your situation—OneDrive, SharePoint, or another online location. Select the appropriate folder and click the Save button.
Once saved, the document reappears with the Share panel open. In the Invite People field, click the open book icon and select colleagues from your address book in Outlook. Set permissions and notifications, then click the Share button to send the document links to your designated colleagues.

7. Smart Lookup
This feature (available in most of the Office 2016 programs) is like having the Internet on speed dial. Also called “Insights” from Bing, the information hails from various resources such as Wikipedia, the Oxford dictionary, Bing image search, and Bing Snapshot.Just place your cursor on any word or highlight any phrase on your spreadsheet and right-click. Select Smart Lookup from the dropdown list. The “Insights” panel opens on the right and displays information and images about the subject you highlighted.

8. Tell Me
Located on the right side of the Ribbon menu after the last tab, this feature provides a search box with a light bulb that says “Tell me what you want to do.” It’s like your personal valet: Ask it a question, command it to do something, or select one of the Recently Used queries, and it obeys.

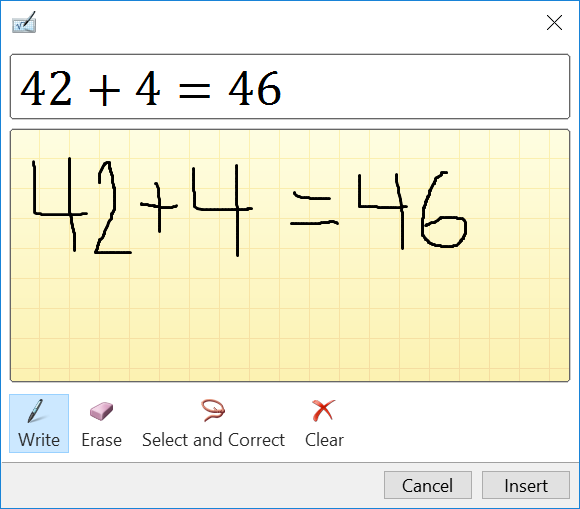
9. Ink Equations
This new feature converts your handwritten equations (or mathematical problems) to text, so you can insert them into your documents. You can use whatever tool works best for you—the mouse, a digital or light pen, or even your fingers—to write the math equations/problems.
Source: http://www.pcworld.com/article/3010614/software-productivity/meet-excel-2016-9-of-its-best-new-features-from-databases-to-handwriting-tools.html#tk.rss_howto
JD Sartain journalist

More by JD Sartain